By: Keir Hart
Just about anyone involved in product development is aware of the criticality of “time to market.” But what does this mean? What happens if we are early, or ‘gulp’ even worse, late? Can this cost of delay be quantified and if so, what can we do about it? In this article, I’ll walk you through what it really means to be late, how to quantify it, and some steps to start things moving in the right direction again.
What is Cost of Delay?
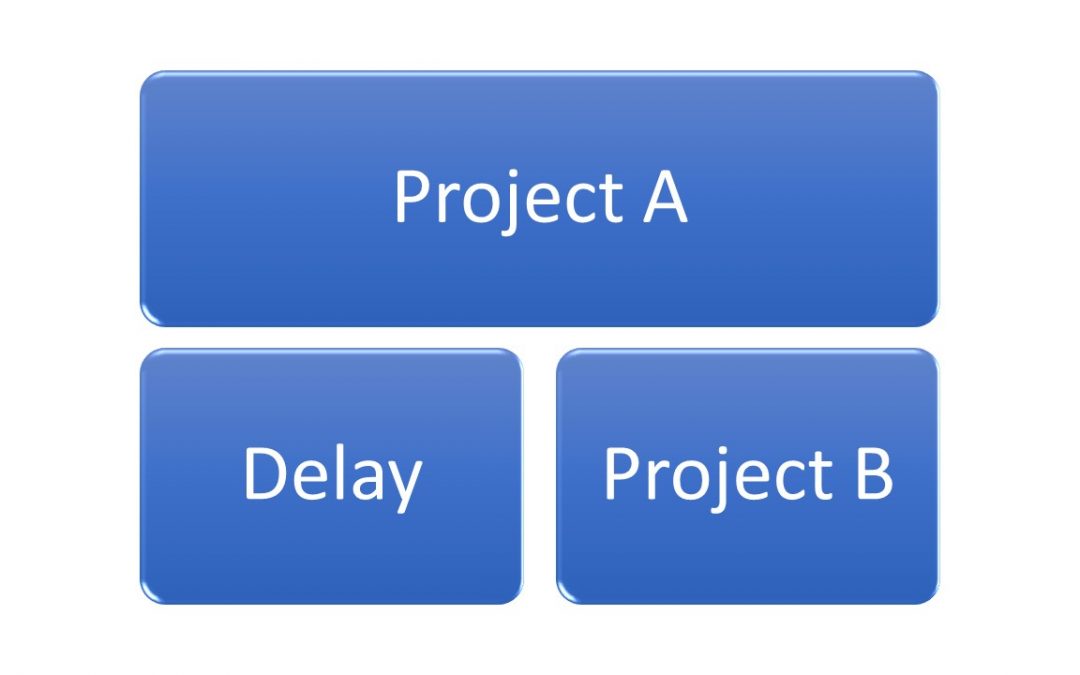
First, what does it mean to be late? Obviously, missing deadlines is a bad thing, but why? If a deadline is missed by a day or two, is that better or worse than missing by a couple of months? Which project should you focus on first, with multiple projects in the queue and only limited resources to do them? Well, as so many trainers are fond of saying, it depends. If you have a critical market launch for a tradeshow on November 1, and you miss the date by a few days, you might miss the entire show and with it, your entire launch opportunity. This could cost your company thousands, if not millions. However, if you are targeting the holiday selling season at the end of the year, and your schedule has the finish date set in July, the project still has plenty of time to recover and meet the selling season. Even if you miss by a couple of months. These two scenarios seem self-explanatory, but what happens if your projects are in more of a grey area? Which one do you focus on first? Should you just do these projects in the order they arrived (called first in first out, or FIFO)? Should you focus on longest duration first? Maybe you should focus on highest profitability first? Calculating your Cost of Delay (COD) can greatly help with this decision process.
How to Determine Cost of Delay?
Finding your Cost of Delay isn’t that tough. Keep it simple and even if you can’t add without a calculator, you can figure your Cost of Delay. Let’s go through a quick example. Say that you have four projects in the development queue as follows:
| Project | Duration (Weeks) | Expected Profit |
| A | 2 | $2,000 |
| B | 8 | $4,000 |
| C | 4 | $8,500 |
| D | 18 | $10,000 |
Step 1 is to determine your Cost of Delay per Duration (CD3). To do this, divide your Expected Profit by the Duration times 1,000. Place this number in the next column. For example, for project C:
Duration X 1,000 = 4 weeks X 1,000 = 4,000 weeks
CD3 = $8,500 / 4,000 weeks = 2.125
| Project | Duration (Weeks) | Expected Profit | CD3 |
| A | 2 | $2,000 | $1.000 |
| B | 8 | $4,000 | $0.500 |
| C | 4 | $8,500 | $2.125 |
| D | 18 | $10,000 | $0.556 |
Your CD3 number gives you a relative idea of how each project compares. The larger the CD3 number, the more significant the consequences of delay. Before we dive more into what this means, let’s look at what happens under the three other scenarios we discussed: prioritizing by FIFO, prioritizing by duration, and prioritizing by profit.
FIFO
To find your FIFO cost of delay, add your total duration and multiply by your total expected profit:
Total Duration = 2 + 8 + 4 + 18 weeks = 32 weeks
Total Expected Profit = $2,000 + $8,500 + $4,000 + $10,000 = $24,500
COD = 32 weeks X $24,500 = $784,000
Duration
To find your Duration priority COD, order your projects by duration, from smallest to largest, and add your total duration for that project. Then, multiply by the project’s expected profit. For example, for Project C:
Total Duration = 2 + 4 weeks = 6 weeks
Total Expected Profit = $8,500
COD = 6 weeks X $8,500 = $51,000
Doing this for each project and adding them up results in the following table:
| Item | Duration (weeks) | Profit | COD |
| Project A | 2 | $2,000.00 | $4,000.000 |
| Project C | 4 | $8,500.00 | $51,000.00 |
| Project B | 8 | $4,000.00 | $56,000.00 |
| Project D | 18 | $10,000.00 | $320,000.00 |
| TOTAL | $431,000.000 |
Profit
Lastly, let’s find our Profit priority COD. To do this, arrange your projects by profit, largest to smallest. Then, using the same formula as above, calculate your COD. For example, for project C:
Total Duration = 18 + 4 weeks = 22 weeks
Total Expected Profit = $8,500
COD = 22 weeks X $8,500 = $187,000
Doing this for each project and adding them up results in the following table:
| Item | Duration (weeks) | Profit | COD |
| Project D | 18 | $10,000.00 | $180,000.00 |
| Project C | 4 | $8,500.00 | $187,000.00 |
| Project B | 8 | $4,000.00 | $120,000.00 |
| Project A | 2 | $2,000.00 | $64,000.00 |
| TOTAL | $551,000.000 |
Cost of Delay Example
OK, we’ve calculated our cost of delay for each prioritization method. Now, let’s look at our CD3 number again. Arrange your projects based on their CD3 number, from highest to lowest. Then, use the above formula to find your COD. We will use project A in our example this time (project C is the highest CD3, but Project A better shows what is going on. We could have used any of the other projects for this example):
Total Duration = 4 + 2 weeks = 6 weeks
Total Expected Profit = $2,000
COD = 6 weeks X $2,000 = $12,000
Doing this for each project and adding them up results in the following table:
| Item | Duration (weeks) | Profit | COD |
| Project C | 4 | $8,500.00 | $34,000.00 |
| Project A | 2 | $2,000.00 | $12,000.00 |
| Project D | 18 | $10,000.00 | $240,000.00 |
| Project B | 8 | $4,000.00 | $128,000.00 |
| TOTAL | $414,000.000 |
The below table summarizes our calculations. Prioritizing on CD3, seems to be the way to go. Duration priority is a close second. However, in our experience at Flying Pig Designs, we have found very few cases where prioritizing on CD3 could be beat by another method. We highly recommend incorporating this calculation into your project prioritization and decision processes.
| Priority | COD |
| No Priority | $784,000.00 |
| Duration Priority | $431,000.000 |
| Profit Priority | $551,000.00 |
| COD priority | $414,000.00 |
Next Steps
In this blog, we covered some of the common ways to prioritize projects and introduced the concept of cost of delay. Hopefully, we have shown that prioritizing on cost of delay minimizes the impact to your business’ bottom line. The next step is for you to do this calculation on some of your own projects and see if you should change how to prioritize them. You can do this calculation on other things too, such as day to day tasks, etc. Remember to keep it simple, as you can always expand this calculation to look at any number of items. The point of this exercise is not to get bogged down in analysis, but rather to make the best decision you can, as fast as you can, with the information you have available to you. After all, it is about time to market.
Keir Hart is a mechanical engineer and product development coach with 15 years of experience in consumer and medical device design. Keir is on a mission to grow a passionate, high-performing, human centered design company focused on improving the world around us and delivering clean, quality, manufacturable designs to our customers. If you need design assistance, be sure to look us up at www.flyingpigdesingsllc.com or on LinkedIn.

Keir Hart is a mechanical engineer and product development coach with 15 years of experience in consumer and medical device design. Keir is on a mission to grow a passionate, high-performing, human centered design company focused on improving the world around us and delivering clean, quality, manufacturable designs to our customers. If you need design assistance, be sure to look us up at www.flyingpigdesingsllc.com or on LinkedIn.